Product URLs and Access
Where each HomeLab tool lives, how to reach it, and with what credentials. All addresses *.homelab.local resolve only inside the LAN, because they are served by the HomeLab's own DNS (Domain Name System): BIND on deborah, 192.168.20.5.
If your machine doesn't use that DNS, add the entries to your hosts file (see HomeLab Overview).
kubectl port-forward → 127.0.0.1:8080Catalog
Everything that has an address, grouped by purpose and ordered by priority within each group.
| Priority | Meaning |
|---|---|
| ⭐ Daily | You use it to operate the HomeLab regularly |
| 🔧 Occasional | You open it when performing a specific task |
| 🔍 Diagnostics | Only when something breaks or a panel shows empty |
| Access Method | Meaning |
|---|---|
| 🌐 Published | Has its own DNS name and Gateway route: opens in the browser |
| 🔌 Via Tunnel | Not published: opens with kubectl port-forward from your machine (see commands) |
| 💻 Server | Used with a command-line tool, not a browser |
1. Management
What you use to operate and change the HomeLab.
| Priority | Product | Address | Access Method | Access | Purpose |
|---|---|---|---|---|---|
| ⭐ | Argo CD | https://argocd.homelab.local |
🌐 | GitHub SSO (team devops) |
See what's deployed, sync, and compare with git |
| 🔧 | Open WebUI (AI assistant) | https://open-webui.homelab.local |
🌐 | GitHub SSO (team devops) |
Chat with the HomeLab's local assistant; a real message can wake an Ollama node (guide) |
| ⭐ | Incus UI | https://incus.homelab.local:8443/ui/ |
🌐 | GitHub SSO or TLS certificate | Virtual machines, containers, networks, and load balancers |
| ⭐ | SSH to Servers | ssh devops@<servidor>.homelab.local (invincible, oliver, deborah) |
💻 | GitHub identity with opkssh (guide) |
Access the nodes |
| ⭐ | Kubernetes API | https://192.168.20.5:6443 (deborah) |
💻 | kubeconfig |
kubectl over the cluster |
| 🔧 | Longhorn UI | http://127.0.0.1:8080 |
🔌 | No login | Volumes, replicas, and disks of the storage |
| 🔧 | vCluster Platform | https://vcluster.homelab.local |
🌐 | GitHub SSO | Virtual clusters. Enabled in Phase 5; without it the URL returns 404 |
2. Observability
To see how the HomeLab is doing and handle alerts. The main one is Grafana; the others are technical consoles for each component.
| Priority | Product | Address | Access Method | Access | Purpose |
|---|---|---|---|---|---|
| ⭐ | Grafana | https://grafana.homelab.local |
🌐 | GitHub SSO (team devops, Admin role); fallback: user admin from item grafana-admin |
Node, temperature, Argo CD, Longhorn, Kong, Incus panels… (what to watch) |
| 🔧 | Alertmanager | http://127.0.0.1:9093 |
🔌 | No login | Active alerts and silence one for a while |
| 🔍 | vmui (on vmsingle) |
http://127.0.0.1:8428/vmui/ |
🔌 | No login | Query metrics; Cardinality explorer to see what takes up the most |
| 🔍 | vmagent | http://127.0.0.1:8429/targets |
🔌 | No login | What's collected and what fails |
| 🔍 | vmalert | http://127.0.0.1:8880 |
🔌 | No login | Alert rules and their last error |
| 🔍 | blackbox-exporter | http://127.0.0.1:9115 |
🔌 | No login | External probe results |
3. Platform (No Daily UI)
Pieces the others depend on. Used for diagnostics.
| Priority | Product | Address | Access Method | Access | Purpose |
|---|---|---|---|---|---|
| 🔍 | Dex (SSO) | https://argocd.homelab.local/api/dex |
🌐 | No UI of its own | OIDC issuer: used by Argo CD, Incus UI, vCluster, Grafana, and SSH with opkssh |
| 🔍 | Gateway (Kong) | 192.168.23.200 |
💻 | — | Receives traffic from argocd, grafana, vcluster, api, open-webui, and ollama |
| 🔍 | Ollama (AI API) | https://ollama.homelab.local |
💻 | Bearer Token (one token per client) | Single router for Ollama nodes; HTTPS only. Inside cluster: http://ollama-router.ai.svc. Used by Open WebUI, K8sGPT, reports, and translation (guide, add a node) |
| 🔍 | DNS (BIND) | 192.168.20.5 |
💻 | — | Zones homelab.local and mco.local |
4. Documentation and code
| Priority | What | Address |
|---|---|---|
| 🔧 | Documentation | https://homelab.maceo.cl (public) |
| 🔧 | Code (Ansible, OpenTofu, documentation) | maceosoft/homelab |
| 🔧 | GitOps manifests | maceosoft/gitops |
| 🔍 | Reusable pipelines | maceosoft/core-pipelines |
Each name has its record in BIND
The zone homelab.local points argocd, vcluster, api, grafana, open-webui, and ollama to the Gateway IP (192.168.23.200), incus to the cluster leader (invincible, 192.168.20.6), and each server (invincible, oliver, deborah) to its own IP. There is no wildcard: a new name does not resolve until its record is added. Only Argo CD, Grafana, Open WebUI, and Ollama have a route in the Gateway; that's why vcluster.homelab.local resolves but returns 404.
If you add a new interface
Document it here in the same change: a row in the corresponding group (with its priority and how to access it) and, if it's not published, its tunnel command in Monitoring consoles or in its own section.
Argo CD
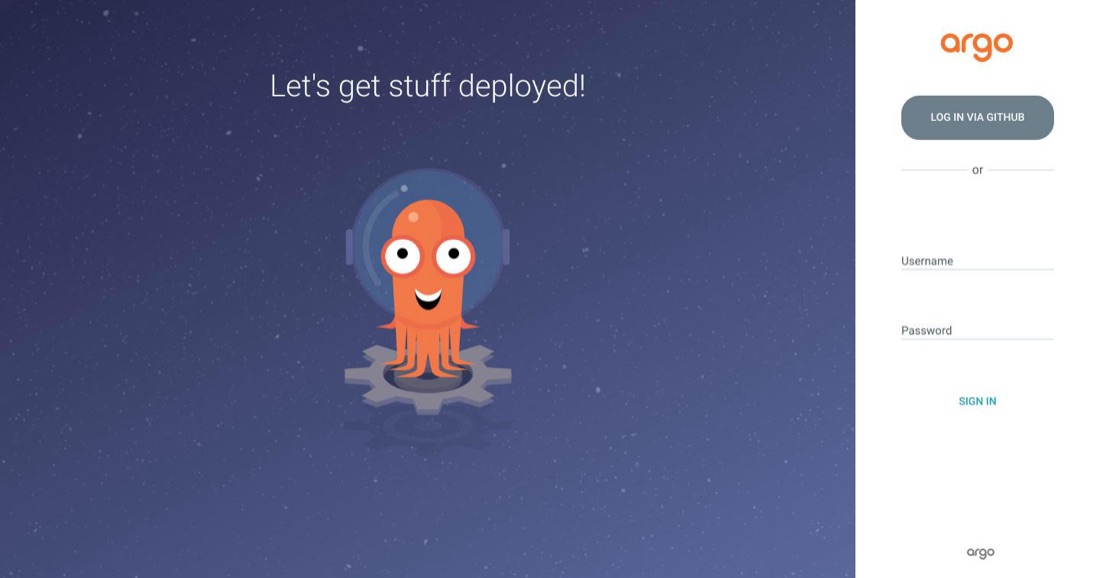
The GitOps interface. It prompts for login with GitHub (Dex); only members of the devops team in the maceosoft organization can enter.
View screenshot: Argo CD login
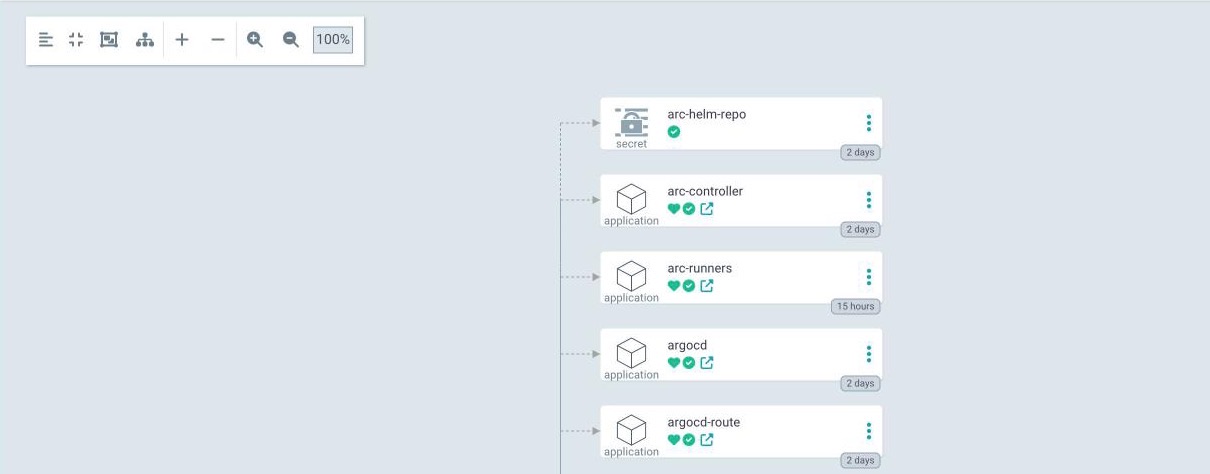
Inside, the root application homelab-root groups all the others (tree view):
View screenshot: homelab-root tree
More on the catalog and common issues: GitOps — catalog and troubleshooting.
Incus UI
The Incus cluster web interface. It's on node invincible (the leader), port 8443; each node also exposes its own API on that port. It offers two ways to log in:
View screenshot: Incus UI access
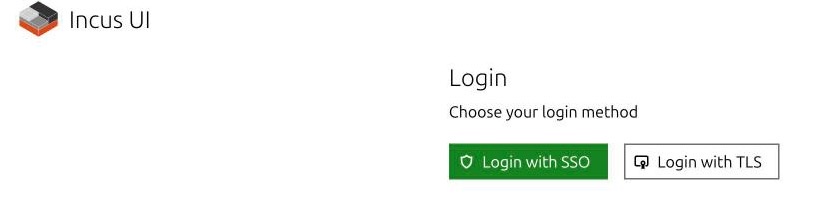
- Login with SSO: GitHub via Dex (OIDC, standard login). See Incus Cluster — OIDC via Dex.
- Login with TLS: with a client certificate installed in the browser.
Network load balancers are in Networks → ovn-lan → 'Load balancers' tab (see Load Balancing and OVN).
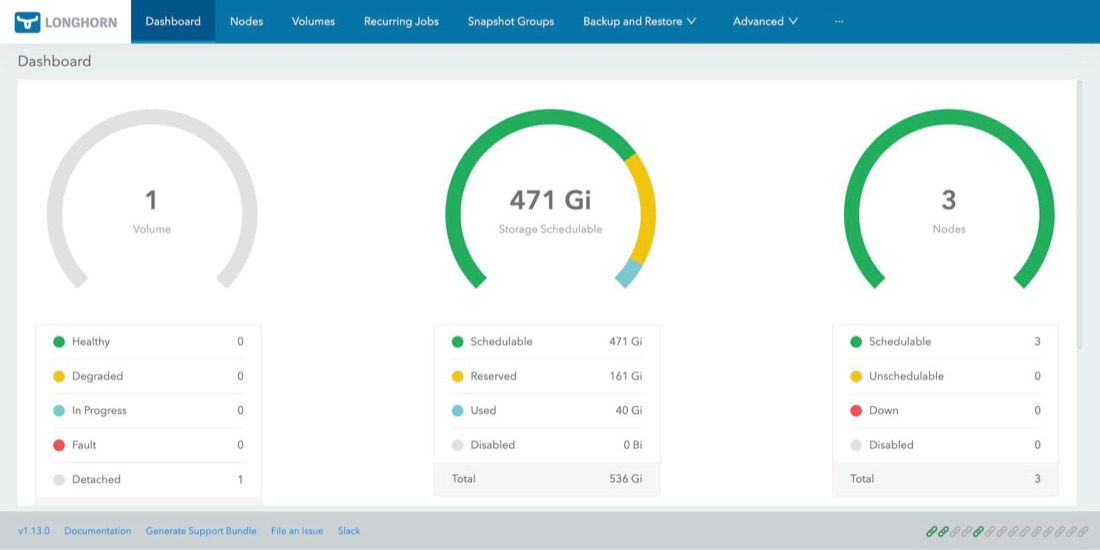
Longhorn UI
The replicated storage has its own dashboard, with no login screen and no route in the Gateway: it's an internal Service. Open it with a temporary tunnel from your machine:
export KUBECONFIG=~/.kube/homelab-k3s.yaml
kubectl -n longhorn-system port-forward svc/longhorn-frontend 8080:80
# y abre http://127.0.0.1:8080  (Ctrl+C para cerrar el túnel)
View screenshot: Longhorn dashboard
More on storage classes: Storage.
Monitoring consoles
The main monitoring interface is Grafana (with SSO). Below are more technical consoles for each component, useful for diagnosis. They have no login and no route in the Gateway: they are internal Services in the monitoring namespace, so they open with a temporary tunnel from your machine (each command leaves the console at 127.0.0.1; Ctrl+C closes the tunnel):
export KUBECONFIG=~/.kube/homelab-k3s.yaml
# vmui
kubectl -n monitoring port-forward svc/vmsingle-vm-victoria-metrics-k8s-stack 8428:8428
# vmagent
kubectl -n monitoring port-forward svc/vmagent-vm-victoria-metrics-k8s-stack 8429:8429
# vmalert
kubectl -n monitoring port-forward svc/vmalert-vm-victoria-metrics-k8s-stack 8880:8080
# Alertmanager
kubectl -n monitoring port-forward svc/vmalertmanager-vm-victoria-metrics-k8s-stack 9093:9093
# blackbox-exporter
kubectl -n monitoring port-forward svc/blackbox-exporter 9115:9115
Each needs its own terminal, and the vmalert port is 8880 to avoid clashing with Longhorn's 8080.
| Console | Address | Purpose |
|---|---|---|
| vmui (VictoriaMetrics) | http://127.0.0.1:8428/vmui/ |
Query and graph metrics without Grafana. The Cardinality explorer tab shows which metrics take up the most space (useful for trimming), and Top queries the slowest queries |
| vmagent | http://127.0.0.1:8429/targets |
What is being collected, which ones fail, and with what error. It's the first thing to check when a panel comes up empty |
| vmalert | http://127.0.0.1:8880 |
Alert rules, their status (firing, pending), and the last evaluation error |
| Alertmanager | http://127.0.0.1:9093 |
Active alerts, silences (to mute an alert for a while), and Discord route configuration |
| blackbox-exporter | http://127.0.0.1:9115 |
Results of external probes (Argo CD, Dex, Grafana, redirects, and DNS) and their modules |
Why they are not published
None of these consoles ask for a user: anyone reaching the address could see all metrics or create silences in Alertmanager. Grafana and Argo CD do have SSO. If they are ever published, authentication must be placed in front (e.g., a proxy with Dex) and a BIND record (each name has its own).
What is monitored and what to do for each alert: Monitoring and alerts.
vCluster Platform
Its address is https://vcluster.homelab.local, but it is not deployed by default: its Application is commented out in gitops/bootstrap/root-appset.yaml and there is no HTTPRoute, so until it's enabled in Phase 5 the URL returns 404.
No dedicated interface
These components have no UI; they are inspected with kubectl or with Argo CD:
| Product | How to inspect |
|---|---|
MetalLB (IP of the LoadBalancer) |
kubectl get ipaddresspool,l2advertisement -n metallb-system; pool 192.168.23.200–.220 |
| Calico (pod network) | kubectl get tigerastatus and kubectl get installation default |
| Kong (Gateway) | kubectl get gateway,httproute -A |
| cert-manager (certificates) | kubectl get clusterissuer,certificate -A |
| OVN (Incus virtual network) | incus network list and ovn-nbctl lb-list on a node |
| ARC (GitHub Actions runners) | kubectl get pods -n arc-runners |
Other links
The repositories are in the catalog. Also:
| What | Where |
|---|---|
| Full documentation in plain text (for AI) | llms-full.txt |
| AI study notebook | Learn with AI |
Verify they respond
for u in https://argocd.homelab.local/ https://grafana.homelab.local/api/health https://incus.homelab.local:8443/ui/; do
  echo "$u -> $(curl -sk -o /dev/null -w '%{http_code}' --max-time 6 $u)"
done
# debe dar 192.168.23.200
dig @192.168.20.5 argocd.homelab.local +short
If a URL doesn't load, start with DNS (dig) and the Gateway (curl -k https://192.168.23.200); the GitOps troubleshooting table covers the most common cases.